- READ TIME
- 3 MIN
- AUTHOR
- AGRICULTURAL OPERATOR
- FILED UNDER
- LOGISTICS
Business Problem
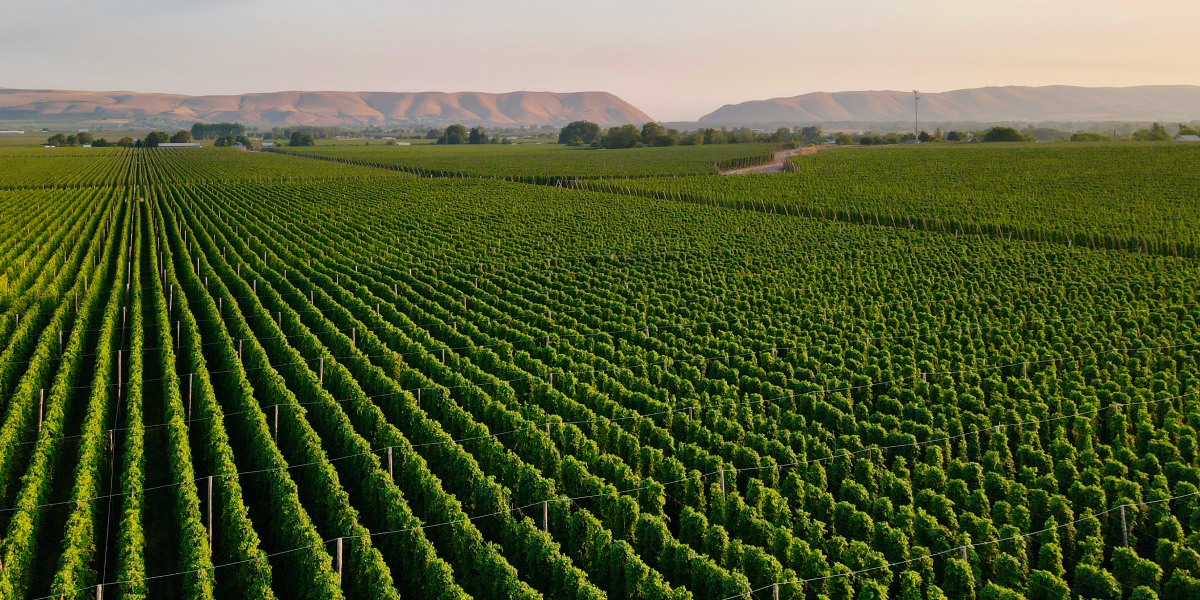
Trucking from field to receiving station to factory is the single biggest moving cost in harvest. This operator runs multiple stations across a wide grower footprint, and queues formed at some stations and not others during peak arrival windows. Leadership was weighing live capital decisions — which station to upgrade, whether to open a new one, how to allocate trucks across locations — and arguing from station-level averages and operator instinct.
Each call was worth millions in capital and a season of grower margin, and the wrong one would compound over years.
Decisions included:
- Which location should receive the next round of capital upgrades?
- Should a new location be opened?
- What is the impact of uneven utilization? Where and when do queues form, how much do they cost in real dollars, and how could they be mitigated economically?
- Is the current allocation of trucks to locations optimal? Is it better to drive farther and unload faster or closer and wait in line?
Root Causes
1) Cost per ton varied by station, but drivers of cost remained opaque. Decisions were made based on averages or anecdote, not measured unit cost or utilization profiles.
2) High peak-to-average utilization ratios created the appearance of a capacity constraint. Certain stations experienced sharp utilization spikes that led to long queues, raising per-ton cost, however, adding further capacity would come with a suboptimal return.
3) Cost per field wasn’t calculated or visualized. True cost-to-serve varied dramatically across locations, but this wasn’t captured in decision-making tools.
4) No marginal acreage model to guide growth. The organization lacked a threshold-based model to show where the next acre would reduce, not grow, profit.
Approach
Station-Level Cost Modeling
Oxrow models end-to-end truck cycle times from historical ticket data — field load, road, and unload segments — combined with a bottom-up trucking cost-per-hour layer. The output is a full picture of transportation cost and its drivers.
Utilization and Queue Impact Analytics
Comparing peak vs. average arrival windows across stations, Oxrow distinguishes cost spikes driven by uneven arrival times from those driven by genuine capacity limits.
Tactical Insights for Capital Planning
The findings equipped leadership to make better decisions about equipment upgrades and explore possible contingencies, e.g., develop incentives for off-peak deliveries, grounded in economics, not guesswork.
Integrated Field-Level Cost Modeling
Field, station, and factory data combine into a single model of the full journey from harvest to delivery. Cycle time and total trucking cost produce a per-field cost map that reveals true contribution margin per location.
Heatmaps and Center-of-Mass Analysis
Heatmaps and centroid-tracking visualize how the footprint of acreage drifts over time — and at what cost.
Scenario Planning for Expansion Decisions
Five acreage growth scenarios were modeled, showing how additional volume would impact total transport costs based on receiving station.
Actionable Tools, Not Just Insights
Decision-ready dashboards and spatial models that could be embedded in station expansion decisions and operational workflows.
Results
Annual transportation costs dropped by 20-25% once the operator could see — and price — the levers that had been hidden. Station-level cost modeling revealed true cost-to-serve across every location. Utilization analytics distinguished real capacity constraints from arrival-pattern problems, preventing a round of unnecessary expansion. Scenario planning gave leadership the confidence to direct capital to the station where the next dollar would actually pay back.
Even small operational changes carried real money: a 15-minute average delay at a single station added up to six figures over the course of a harvest. Heatmaps and center-of-mass analysis made acreage drift visible and priced, so the next year’s planting decisions could be made with the same lens.